What is Business Intelligence? + Ways Security Firms Use Technology to Improve it

Trackforce
December 10, 2020 · 12 min read
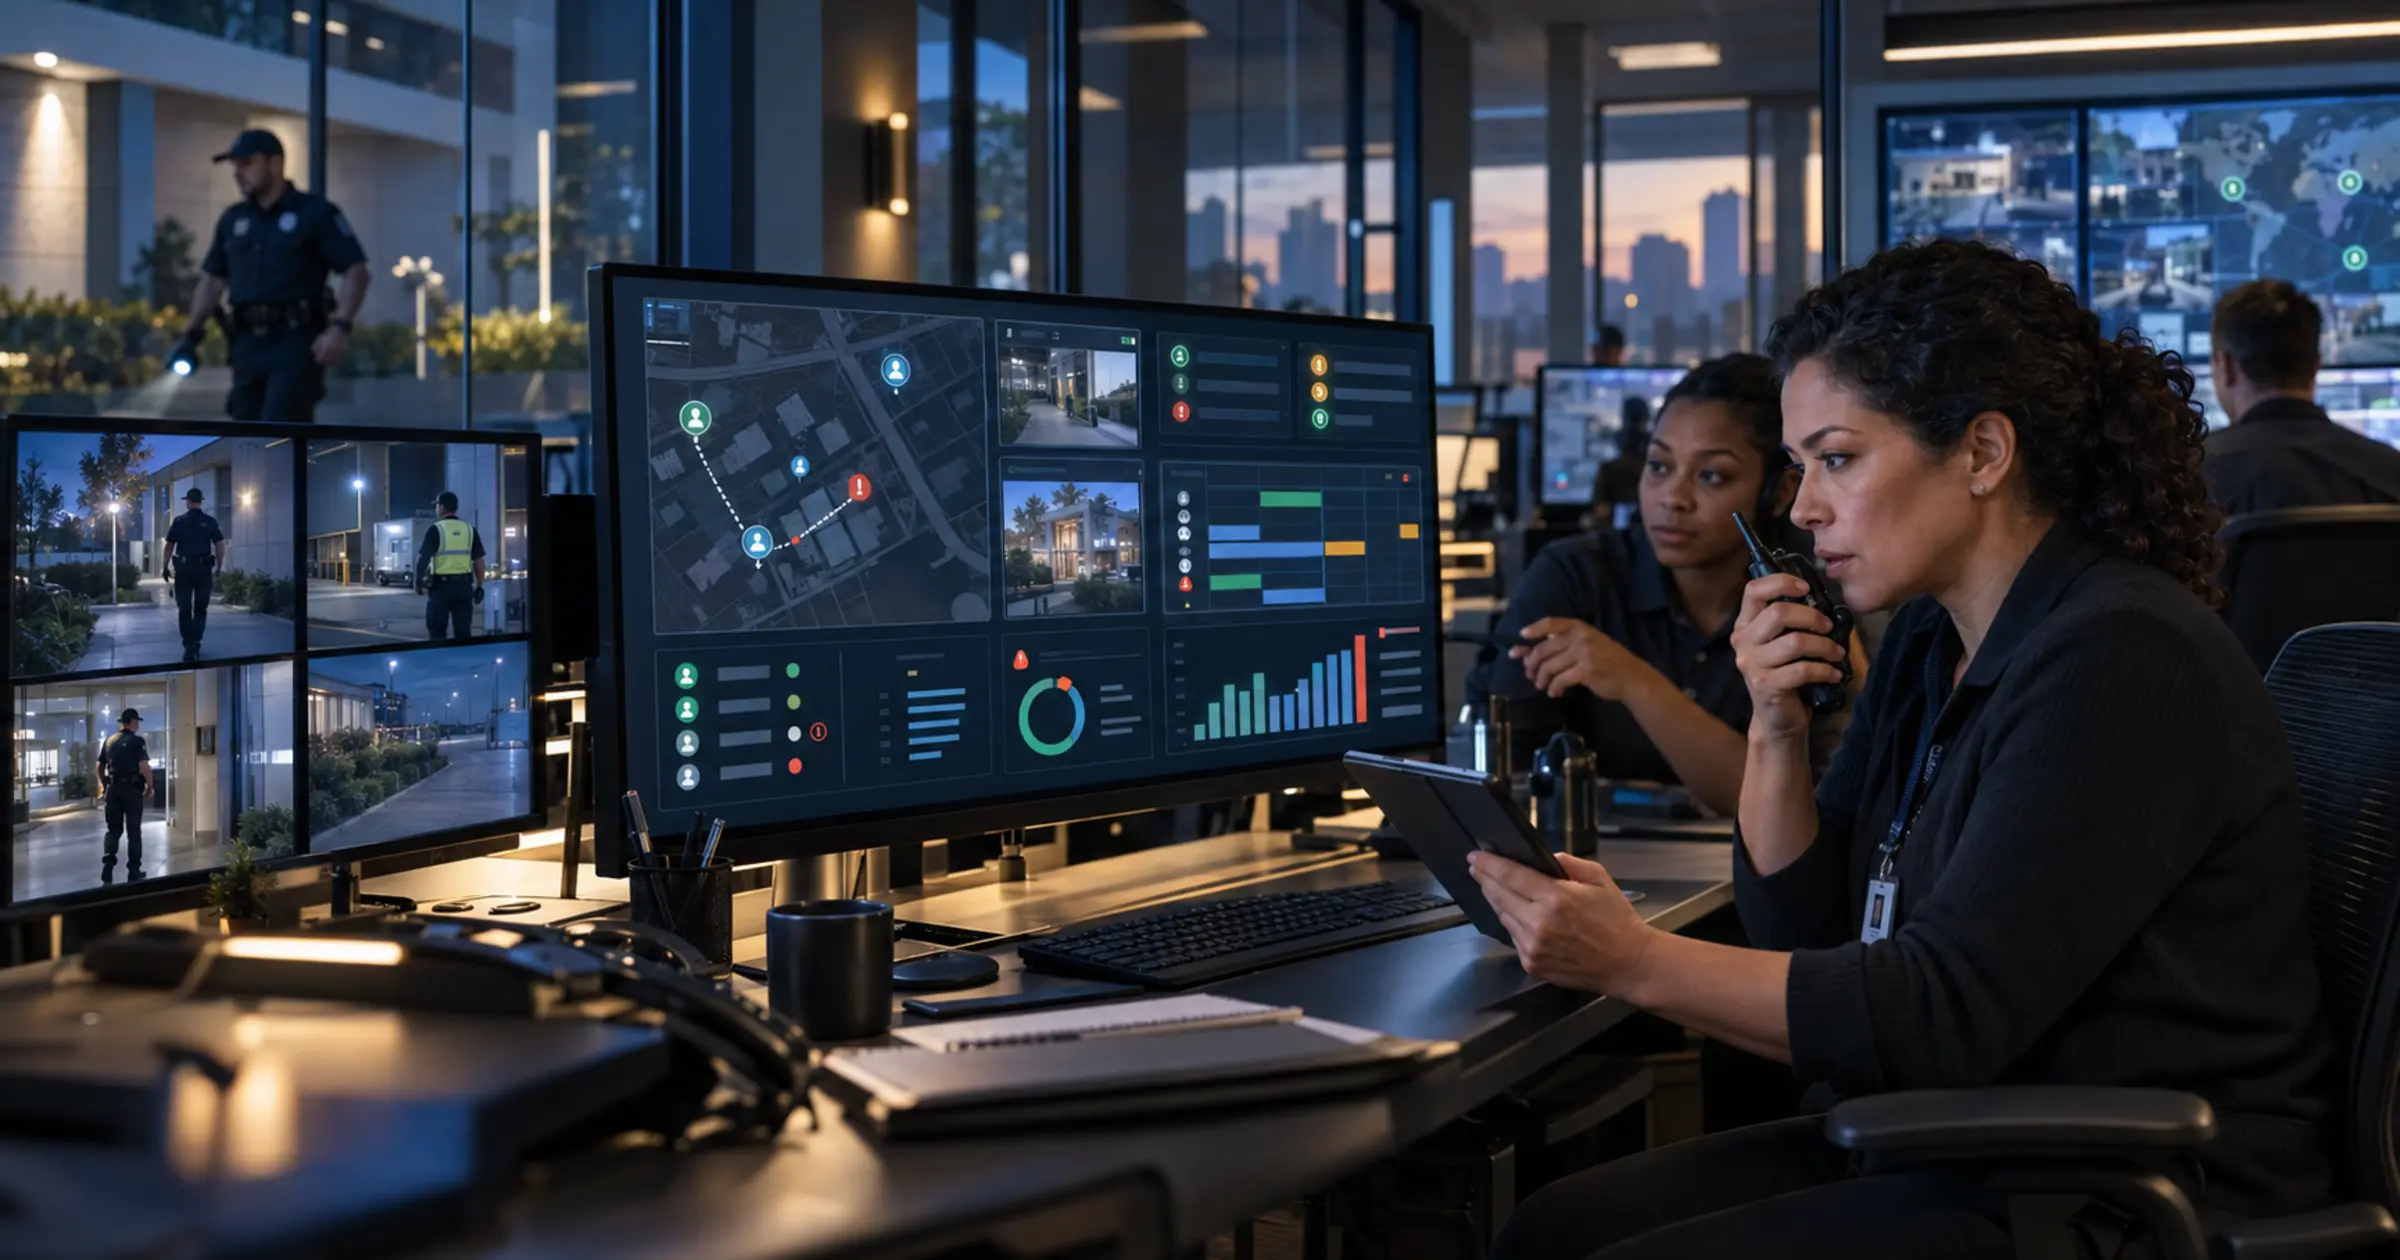
Business Intelligence (BI) takes data and information gathered by technology in order to deliver insights that are actionable, resourceful, and meaningful to your operations.
When thinking about how Business Intelligence can impact your operations for the better, there are two key components physical security companies can use to leverage technology: real-time data and a centralized dashboard.
Key takeaways
- Business intelligence is data you can act on, not data you can display.
A dashboard that nobody changes a decision because of is a reporting exercise rather than intelligence. - In security, the raw material is already being collected.
Checkpoint scans, incident reports, shift data and attendance are captured every day. The gap is usually analysis, not collection. - Real-time and historical data do different jobs.
Real-time answers what is happening now. Historical answers whether it keeps happening, which is the question that changes staffing and pricing. - Supervisors need retraining, not just a login.
Moving from hunting for data to reviewing data that arrives on its own is a genuine change in how the job is done. - TrackTik is where the data and the dashboard meet.
Because tours, incidents, scheduling and billing run on one record, the reporting reflects the whole operation rather than one slice of it.
Real-Time Data From the Frontline
For physical security, the data and analysis gathered that become Business Intelligence comprises historical and real-time information, such as with incident reporting, guard activity, shift data, and scheduling, to name a few components.
A security company’s health is only as good as the insights it receives from their guards on the frontline. As a crucial indicator to the overall health of a security company, data captured in real-time sets the baseline numbers for any actionable insights determined by Business Intelligence.
In practice, the real-time signals worth watching are:
- Completed or missed guard checkpoints
- Daily activity reports and incident reports filed by guards in the field
- Which guards are on break and which are actively on shift
- Current locations of remote and mobile guards across one or multiple sites
- Real-time guard scheduling and shift data
In order for real-time data to provide actionable insights, and to improve a security company’s Business Intelligence, data must be analyzed and collected under a single view, which means a dashboard.
A Centralized Dashboard for Data Visualization
In using a centralized dashboard, supervisors can keep track of site incidents, missed checkpoints, and emergency alerts, and can aid in three essential points: guard schedules, training, and overtime.
Eliminate Scheduling Conflicts
Manually keeping a record of security guard attendance is inefficient and can lead to errors. Tracking employee time and attendance can efficiently eliminate scheduling conflicts and identify employees that may be struggling in this area in order to administer the necessary corrective actions. In guard management the schedule and the attendance record are the same object, which is what removes the reconciliation step.
Unify Employee Training
Keeping track of who has and hasn’t completed what training courses shouldn’t be a difficult task once data is gathered in real-time. With a centralized dashboard, supervisors can easily see who has and hasn’t completed training courses, which makes it far easier to maintain compliance or keep contract terms. Certification and training records sit alongside the roster in people management, so an expired certificate blocks a shift assignment rather than surfacing during an audit.
Manage Overtime With Time and Labor Data
Have supervisors keep track of employee time, eliminating unnecessary costs associated with collecting and analyzing data. Rather than downloading reports into paper or spreadsheets, supervisors and managers can rely on current and historical information to solve security issues and to handle back-office responsibilities, such as invoicing. The back office suite is where that attendance data becomes payroll and a defensible invoice.
Four Questions Business Intelligence Should Answer
The quickest way to tell whether a dashboard is producing intelligence is to ask what decision it changed this month. If the answer is none, the data is being displayed rather than used. These four questions are a reasonable starting standard for a security operation.
| The question | Where the answer comes from |
|---|---|
| Which sites are quietly drifting below standard? | Checkpoint completion rates trended over months, not this week’s total |
| Which contracts are costing more to service than they earn? | Scheduled versus actual hours, plus overtime concentration by site |
| Where is turnover actually coming from? | Attrition grouped by supervisor and site rather than company-wide |
| Which incidents are recurring rather than isolated? | Incident type and location patterns across the full history |
Notice that none of these are answerable from a live view alone. Real-time data tells you what is happening right now, which matters for response. These four need history, which is the half of business intelligence that most security operations never get to because the data is scattered across systems that were never meant to talk to each other.
Ensuring Your Team is Trained to Act on Business Intelligence
Having your operational insights visualized in a dashboard in real-time is only half of the journey. Your team must know how to interpret the data in order to have meaningful action that results in stronger Business Intelligence.
How to Prepare Your Team for Better Analysis
Alongside the basic operational skills supervisors already implement daily, when using real-time data, insights are immediate. Immediate insights not only streamline processes like reporting, guard shift swaps, and incident alerts, but document a digital record of events for historical backtracking.
In streamlining processes, supervisors can delegate once time-consuming actions, like data hunting and verification, and focus on reviewing the information that has been collected for them. This would require a shift in how supervisors analyze data, and it is worth naming that shift openly rather than assuming it happens on its own. A supervisor who spent years chasing information is not automatically comfortable being handed it.
With just a few clicks, supervisors can access site health stats on:
- Current and historical incidents
- Open and closed reports
- Shift data across a time range per site or guard
- On time or missed checkpoints
- Current and past location data for remote guards
- Lone worker status
Turning a Report Into a Decision
Most security operations already receive more reporting than they use. The habit that converts it into business intelligence is small and repeatable, and it works better as a weekly discipline than a quarterly project.
- Start from the exceptions. Open the missed checkpoints, the late clock-ins and the sites filing unusually few reports. Totals hide problems, exceptions surface them.
- Ask whether it is a pattern or an event. One missed patrol is an event. The same post missed every Sunday night is a staffing or supervision problem wearing a different hat.
- Name the decision the number implies. Reassign a supervisor, adjust a schedule, renegotiate a rate, retrain a team. If no decision follows, the metric is not worth reporting.
- Record what you changed and when. Without this you cannot tell next quarter whether the intervention worked or the problem simply moved.
- Share the relevant slice with the client. Coverage and incident trends are exactly what a client wants at renewal, and showing them unprompted is far stronger than producing them under pressure.
For a walkthrough of the dashboard mechanics behind this, using a security operations dashboard to gain business intelligence covers the screen-level detail.
Common Business Intelligence Mistakes in Security Operations
- Measuring activity instead of outcomes. Tours completed is an input. Incidents prevented, response times and client retention are what the business is actually buying.
- Building a dashboard nobody has time to open. Reporting that requires a person to go looking for it loses to reporting that arrives on a schedule.
- Reporting per system rather than per site. If scheduling, patrols and incidents each produce their own report, somebody has to reconcile three views of one site, and usually nobody does.
- Treating every metric as equally urgent. A dashboard with forty tiles communicates nothing. Six that map to real decisions communicate plenty.
- Keeping the intelligence internal. The data that justifies your rate is the data the client never sees unless you show them.
Where TrackTik Fits
The reason business intelligence is hard in this industry is rarely a shortage of data. It is that the data lives in separate places. TrackTik, the security workforce management platform from Trackforce, is built so the reporting layer sits on one operating record rather than on four exports.
- The reporting layer itself. Business intelligence gives you trend views across sites, clients and time ranges, which is the half that answers the four questions above.
- The live operational picture. The command center is the real-time dashboard: open incidents, active shifts, dispatch status and alerts in one view.
- Clean input data. Intelligence inherits the quality of its source, so structured field capture through tours and incident reporting matters more than the sophistication of the chart on top of it.
- The commercial half. Security operations data connects through to billing, so questions about contract profitability are answerable rather than estimated.
- One record across the whole operation. The TrackTik platform keeps scheduling, tours, incidents, dispatch and invoicing together, which is what makes a site-level view possible at all.
The test of a business intelligence dashboard is not how much it shows. It is whether anyone changed a decision because of it last month.
Harnessing Business Intelligence for Better Operations
Elevating your operations beyond typical manual processes will effectively lead to impactful and actionable Business Intelligence.
With information harnessed in real-time and streamlining processes that would otherwise impede effective action, supervisors can leverage technology to better review current and historical stats derived from their guards on the frontline, such as shift data, schedules, reports, incidents, checkpoint data, and even guard location data.
When managing guards remotely, and especially when resources are tight, supervisors can still make informed decisions from wherever they are working. Together with a real-time dashboard and comprehensive incident and activity reporting, supervisors gain genuine visibility into guards on patrol, which is what makes stronger analysis and better Business Intelligence possible.
If you want to see what this reporting looks like against live site data rather than a sample, you can request a TrackTik demo.
Frequently Asked Questions
Latest Articles
Featured Resources
See Trackforce in action
Book a walkthrough with our team and see how it fits your operation.