Why Your Security Guard Management Software Needs a Live Dashboard

Trackforce
February 3, 2021 · 13 min read
Security guard management software is a modern-day necessity in the physical security industry, but not every solution is the same. Making sure that each aspect of the guard management software your operation is running will meet you and your client’s needs is essential.
But what should you be looking for? What parts of the software are important?
The standard features that private security companies tend to look for in their guard management software are guard tours, patrol check-point systems, and GPS mapping. All of those features are necessary, but what good are they if you cannot track these data points in real time?
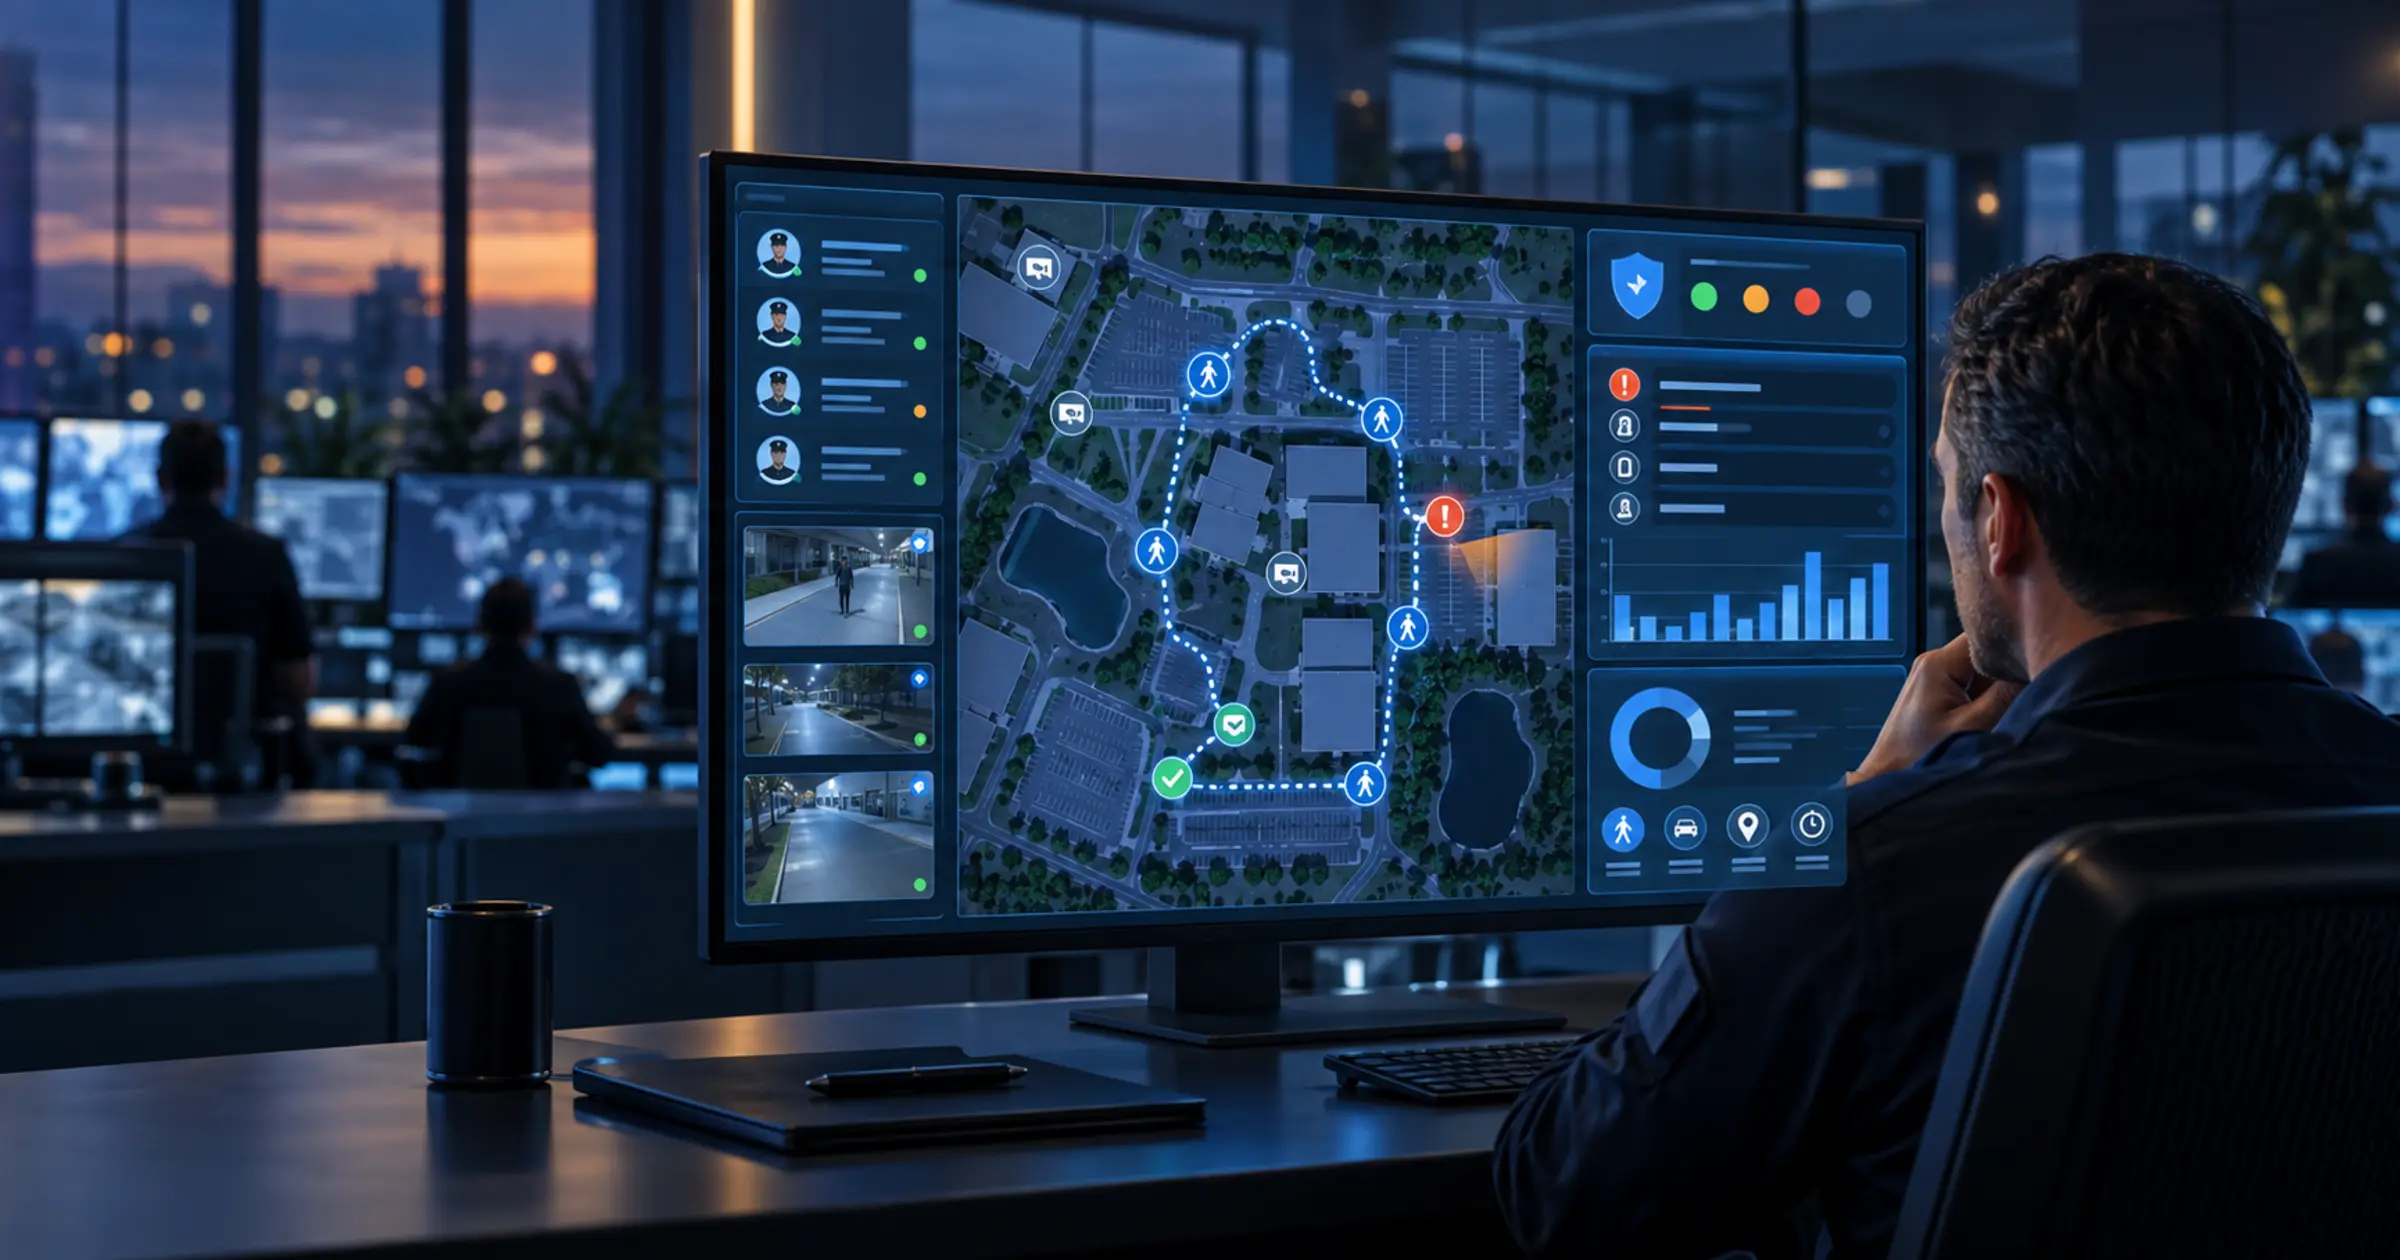
When your guard management software has a live dashboard, it brings all of these important pieces of information together, so that your security supervisors, admins and clients all have full transparency and insight into what is happening on the property.
Key takeaways
- Tours, checkpoints and GPS are inputs, not answers.
They only change a decision if someone can see them while the shift is still running, which is what a live dashboard is for. - A dashboard is how you defend the work.
When a client claims a patrol was missed, the record either exists in a form you can show them or the argument comes down to who sounds more certain. - Standard and configurable views solve different problems.
A preset incident monitor answers “what needs attention now”, while a configurable business intelligence dashboard answers “what is the pattern across sites”. - Different people need different dashboards.
An officer, a supervisor, an operations manager, the client and the owner are each answering a different question, and one shared screen serves none of them well. - Client portals do not replace service, they prove it.
A client who can check their own property stops auditing you, which is most of what renewal confidence actually is.
What are security guard management dashboards?
Security guard management dashboards are the birds-eye view of activity, or non-activity, on the properties your operation is securing.
At the simpler end, a standard incident monitor is an easy to navigate view that shows issues by property, issue level and assignee in a simple table. On logging in, a security supervisor or administrator can immediately identify the who, what, where and when of an issue or incident.
At the other end, a configurable dashboard is a visual workspace built from drag-and-drop widgets that supervisors and admins arrange around their own use cases. In TrackTik, both live in the same platform, so an operation does not have to choose one and lose the other.
Dashboards are how a security business justifies its good work on site and protects itself when a client accuses it of wrongdoing or neglect.
Standard, out-of-the-box dashboards
The size of your company and the security services you offer are generally what determine the type of guard management software an operation needs. The same rules apply when looking at the dashboards inside that software.
Out-of-the-box views are great for small to mid-sized operations that need a simple, straightforward way to track guard tours and issues by property.
In a standard incident reporting monitor, a user logs in and immediately sees:
- Issue ID
- Property name
- Reported issue
- Created date
- Created by
- Assigned to
The user can then click an issue to drill down and gather further information. This is useful for more severe issues, like theft or vandalism, that a supervisor needs to speak to a client about directly. The monitor also clearly shows when a checkpoint was missed, so that action can be taken.
This level of clarity, combined with automated alerts when a checkpoint is missed or a guard is a no-show, helps maintain the proactive operation your security business strives to be. A supervisor can tend to issues before the client becomes aware, and route someone to site through guard dispatch rather than discovering the gap the next morning.
From the same view, users can typically reach the other tools they need, including reports, user management, system management and property management.
Standard dashboards are a good fit for small to medium sized operations that want an easy to implement, single view of the whole operation in one place.
Configurable dashboards
As mentioned above, configurable solutions come with an adjustable dashboard for viewing the specific data points your operation wants to see. Those may include guard activity, property activity or reporting analytics.
These dashboards can display data in numerous ways, including bar graphs, pie charts and maps. Combined with a real-time activity view, that helps larger and more complex security businesses stay on top of a potentially chaotic administrative load. TrackTik Business Intelligence is built for exactly this: a drag-and-drop dashboard builder that needs no code, covering guard activity, incidents and compliance metrics, with reports that export and share as links or PDFs.
With configurable dashboards, users generally get configurable reporting templates too, adding another layer of transparency and analysis. That keeps supervisor and admin teams on top of the day to day while also tracking the long-term health of the operation. For an enterprise security team, the same data can be replicated out to the BI tools analysts already use rather than living in a silo.
This level of transparency helps maintain client satisfaction and supports long-term growth planning.
Who is looking at the dashboard, and what they need
The most common dashboard mistake is building one screen and pointing everyone at it. Five audiences look at the same operational data and each is answering a different question:
|
Who is looking |
The question they need answered |
What the dashboard should surface |
|---|---|---|
|
Officer on shift |
What am I meant to do next, and did it register? |
The assigned tour, the next checkpoint, and confirmation the scan landed |
|
Site supervisor |
Is anything going wrong right now? |
Missed checkpoints, open incidents, no-shows and live officer positions |
|
Operations manager |
Which sites need me this week? |
Tour completion and fill rate by site, incident volume by type, overtime trend |
|
The client |
Is my property actually being covered? |
Completed tours on their site, incidents with outcomes, and a weekly summary they can open themselves |
|
Executive or owner |
Which contracts are healthy? |
Coverage and margin by contract, compliance exposure, and the trend across the term |
Notice how little overlap there is between the top and bottom rows. The officer needs the next action, the owner needs a trend across months, and building a single view that tries to serve both usually produces one nobody uses. The officer’s view lives in the guard tour app, not on a wall monitor.
Metrics worth putting on a live dashboard
A live dashboard earns its place when every tile changes a decision. These six carry most of the weight in a guarding security operation:
- Tour completion rate by site. The single best proxy for whether the service you sold is the service being delivered.
- Missed checkpoints, with reasons attached. A bare count invites blame. A count with reasons drives a fix, whether that is a broken NFC tag or a tour designed for more time than the shift allows.
- Time from incident reported to acknowledged. This is the number clients quote back at you, so it should never be a surprise to you first.
- Shift fill rate and open shifts. Coverage risk is visible hours before it becomes an uncovered post, if anyone is looking.
- Incident volume by type and location. Patterns only appear in aggregate. Three months of dispatch data concentrated in one stairwell is a fixable problem, not a staffing one.
- Overtime against plan. The earliest reliable warning that a contract is drifting away from the margin you bid.
Dashboards and reports are not the same thing
These get used interchangeably and they do different jobs. A dashboard is for the present tense: it answers what is happening now and what needs someone’s attention in the next hour. A report is for the past tense: it answers what happened over a period and whether the trend is going the right way.
Operations that confuse the two end up with a dashboard nobody checks, because it is full of month-to-date totals that never change during a shift, and monthly reports that arrive too late to act on. Keep live tiles for things a supervisor can still influence today, and push the rest into scheduled reporting. ReportPro AI helps on the report side by drafting incident narratives from what officers actually logged, which is usually what makes reporting slip in a busy month.
Client portals
Of course it is important for an operation’s supervisors and admins to have access to all of the information that dashboards can provide, but what about clients?
Solutions that give clients access to their own portals allow for greater transparency and add value to the services your operation already provides.
On top of automated client reporting, clients can log in themselves to see what is happening on their property without having to go through you. It saves everyone time and energy by streamlining access to all of this information. Where alarms, video and dispatch also need to sit in one place, the Command Center consolidates them into a single real-time workspace rather than a row of disconnected screens.
Client portals do not make up for great customer service, but they do enhance it. With that transparency and service, clients stay happy, are more inclined to renew their contract, and are more likely to refer you to other potential clients.
Rolling out dashboards without overwhelming your team
- Start with one question per role. Ask each supervisor the one thing they currently open three screens to find out, and build that tile first.
- Cap the first version at six tiles. A dashboard people actually read beats a complete one they ignore. You can always add.
- Attach an action to every tile. If nobody can say what they would do differently when a number turns red, that tile is decoration.
- Pilot the client view on one friendly account. Let one client use the portal for a month and tell you what they ignored, before you roll it out across the book.
- Review the dashboard itself each quarter. Tiles nobody has clicked in three months should come off, the same as any other unused report.
Choosing the right dashboard for your operation
Guard management software with transparent dashboards is a major component of a streamlined, well-organized operation, and of client satisfaction.
Whether you are a small to mid-sized security firm looking for a standard view or a larger operation that needs something configurable, the practical test is the same: can a supervisor act on it during the shift, and can a client open it without calling you? If the answer to both is yes, the dashboard is doing its job. You can book a TrackTik demo and see both the standard and configurable views running against sites like your own.
Frequently Asked Questions
Latest Articles


Featured Resources
See Trackforce in action
Book a walkthrough with our team and see how it fits your operation.